Introduction
WebPlotDigitizer is a powerful, web-based tool that allows users to extract data from various types of graphs, charts, and plots. Developed by Automeris, it provides a convenient and intuitive platform for converting graphical data into usable numerical values.
This is especially useful when working with images of scientific graphs or plots where raw data is unavailable. Whether you’re a researcher, engineer, or student, WebPlotDigitizer helps in digitizing data from scanned images, enabling you to perform further analysis with the extracted data.
Installation & Setup
One of the best aspects of WebPlotDigitizer is that it requires no complex installation. Since it is a web-based tool, you can access it from any modern browser without installing anything on your local machine.
Getting Started
Follow these simple steps to start using WebPlotDigitizer:
- Visit the official website: WebPlotDigitizer - Automeris.
- Launch the tool: Click on the “Launch WebPlotDigitizer” button.
- Start using it immediately: Upload your image (graph, plot, or chart) and begin extracting data.
For advanced features like batch processing or saving projects, you may consider creating an account, but this step is optional.
Key Features & Explanation
WebPlotDigitizer offers a range of features that make it one of the most versatile and user-friendly tools for extracting data from images. Below are some of its key features:
Support for Multiple Plot Types
WebPlotDigitizer supports various plot types, including:
- XY Plots
- Bar Charts
- Pie Charts
- Polar Plots
- Box Plots
- Maps (Raster Images)
This versatility allows users to extract data from a wide range of graphical sources.
Manual and Automated Digitization
- Manual Mode: Click on points manually for precise extraction.
- Auto Mode: The tool can automatically detect and digitize points, making the process faster and more efficient for well-defined graphs.
Image Calibration
WebPlotDigitizer enables you to calibrate the image by setting the origin and defining the axes, ensuring accuracy when extracting data from non-standard or skewed graphs.
Data Export
Once data is extracted, you can export it in multiple formats, including:
- CSV
- JSON
- Excel
This makes it easy to integrate the extracted data into further analysis or other applications.
Point Detection and Curve Fitting
WebPlotDigitizer allows you to detect and fit curves to the data points, making it useful when working with continuous curves in graphs.
Code & Libraries involved: Using WebPlotDigitizer Data in Python
WebPlotDigitizer is not a code-based tool, but it integrates seamlessly with external tools for further analysis. Here’s a simple example of how you might use the digitized data with Python to plot it using Pandas and Matplotlib.
Step 1: Extract Data using WebPlotDigitizer
After digitizing a graph (e.g., extracting data from an XY plot), you can export the data as a CSV file.
Step 2: Import and Plot Data in Python
import pandas as pd
import matplotlib.pyplot as plt

# Load the CSV data
data = pd.read_csv('your file name.csv')

# Assuming the CSV has columns 'X' and 'Y' for the data points
plt.plot(data['X'], data['Y'])
plt.title('Digitized Data from Graph')
plt.xlabel('X-axis')
plt.ylabel('Y-axis')
plt.show()
After running above code we get a example graph as shown below and follow the instructions given below
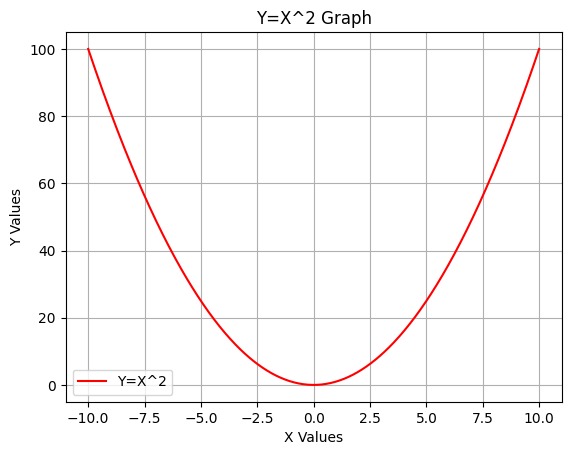
taken y = x² curve for example
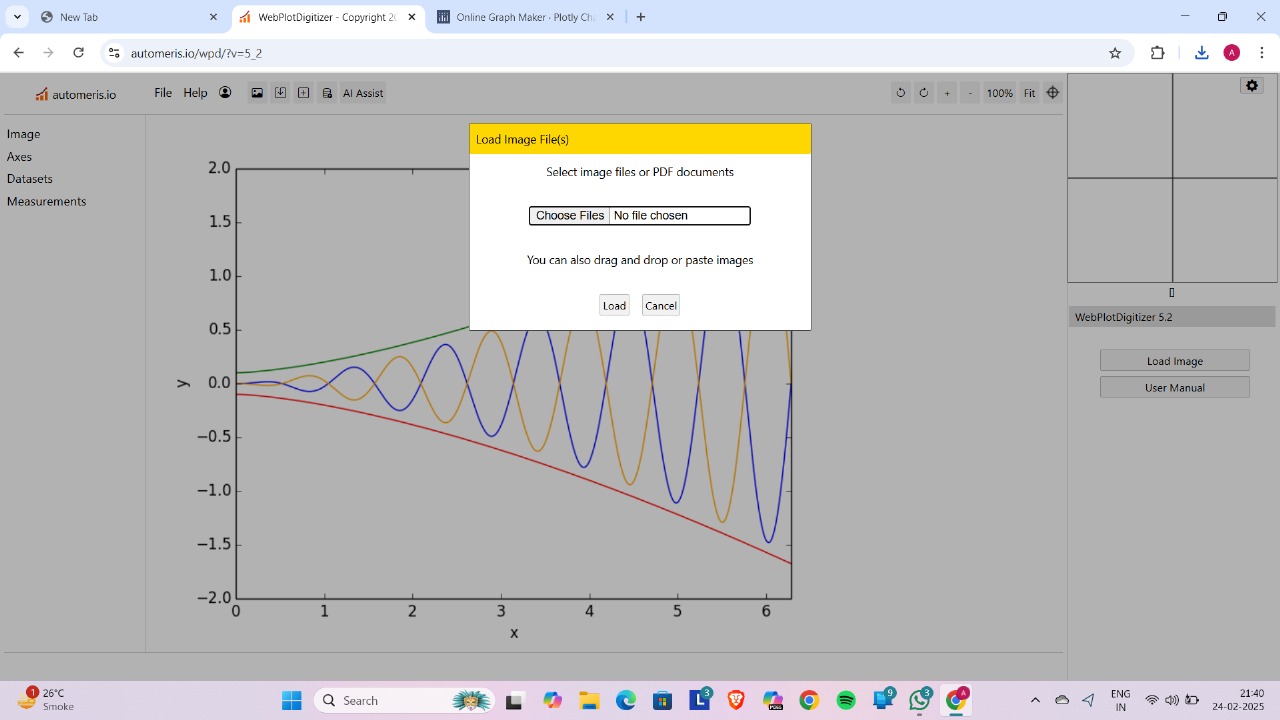
Choose the required file from your drive/PC
___
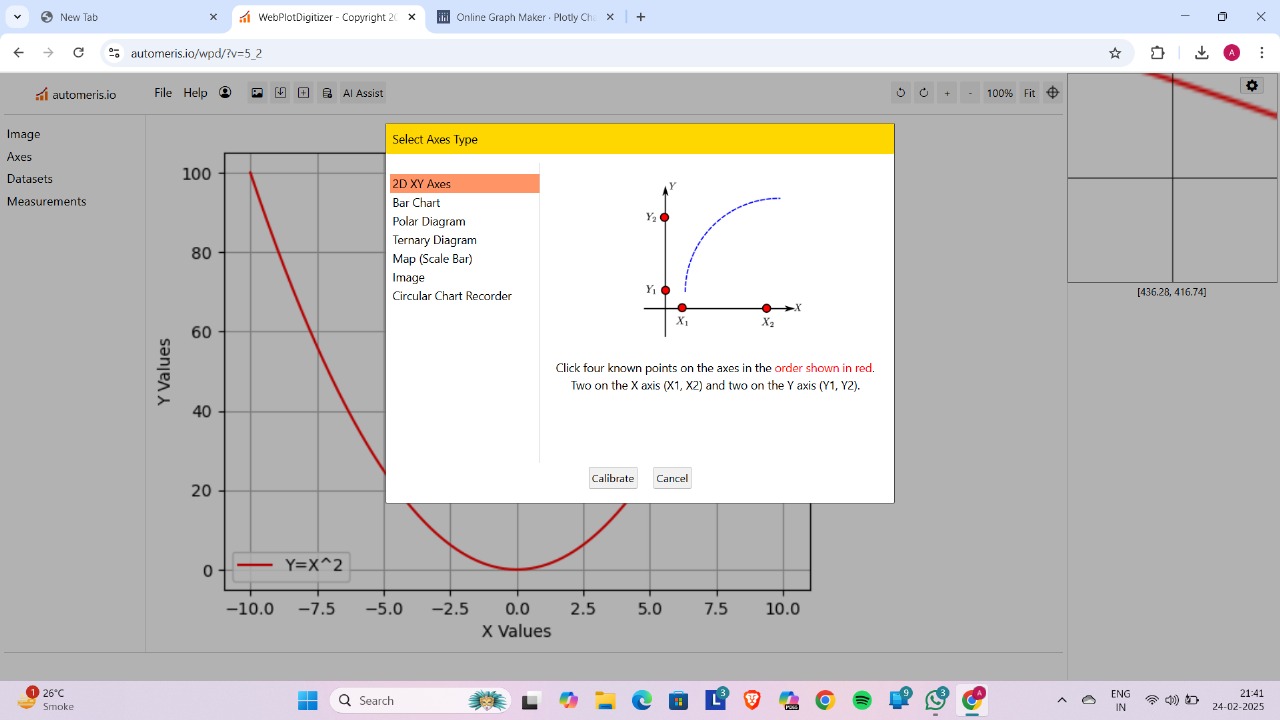
Calibrate it as shown in the figure
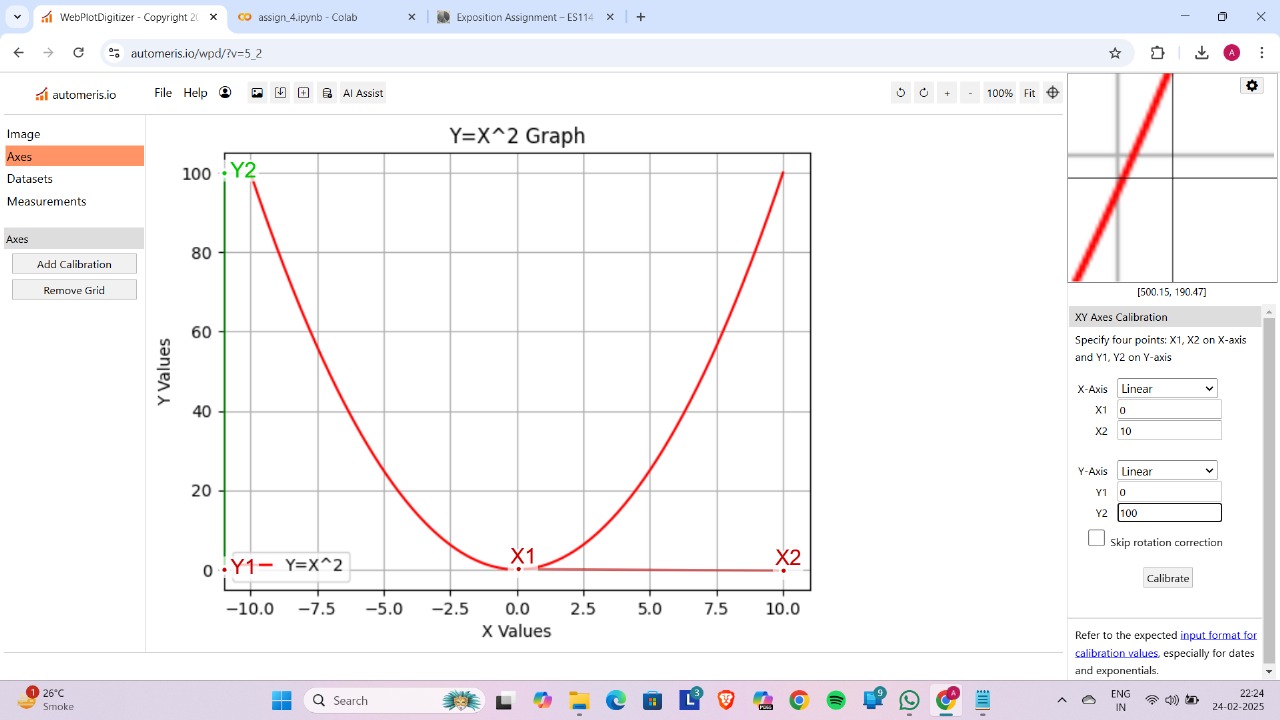
Select two coordinates of x and y and calibrate them
____
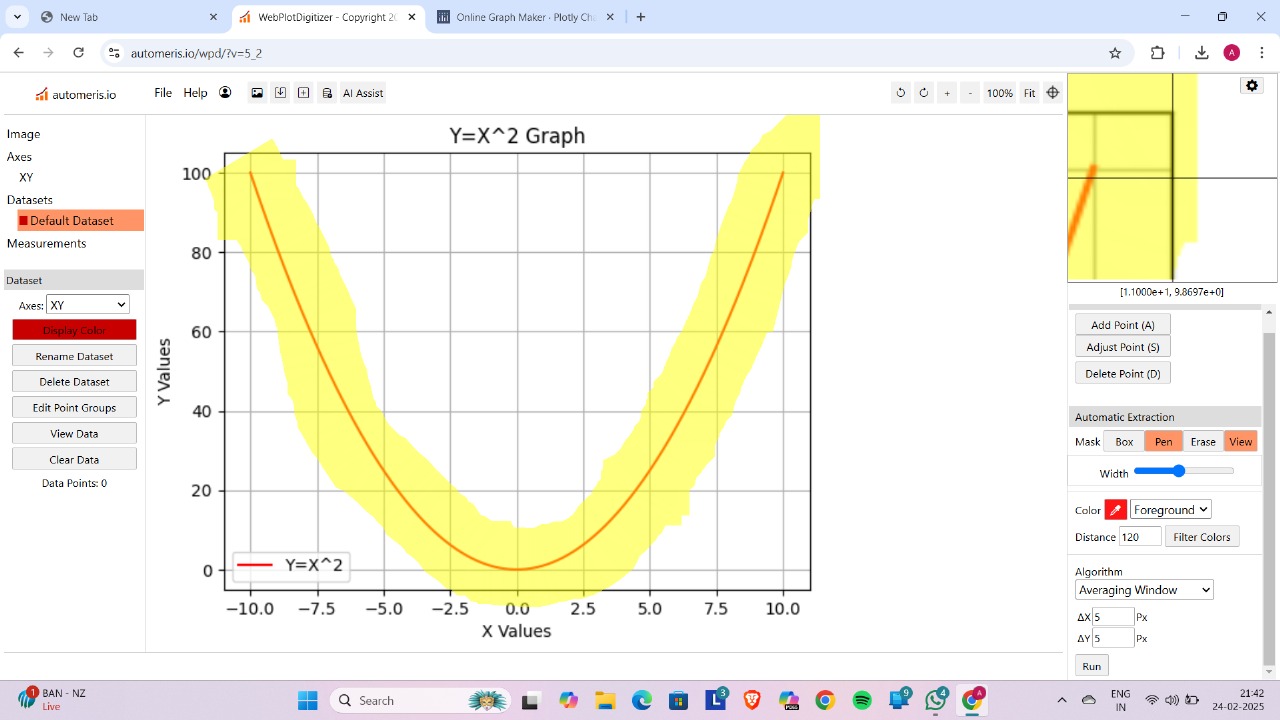 highlight the curve to take values using pen and and auto number of points to be chosen on the selected curve.
___
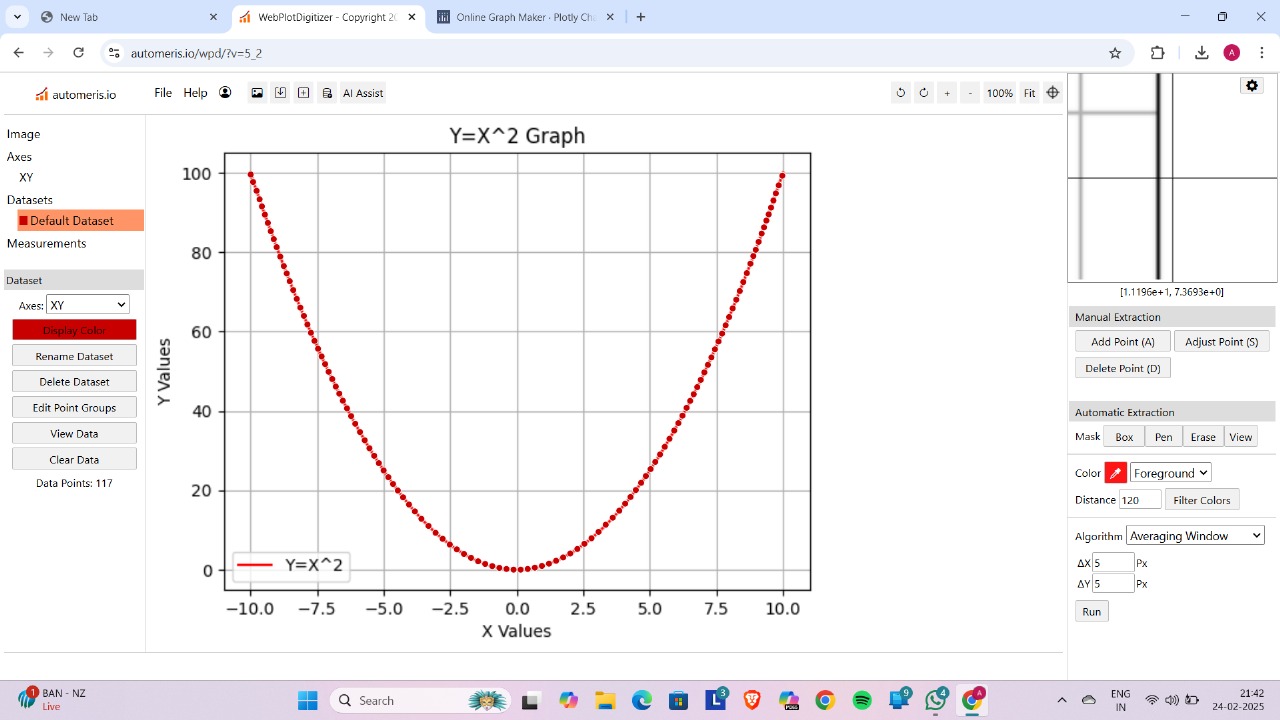 After that we get the points as shown and we go into View data option in bottom-left panel.
___
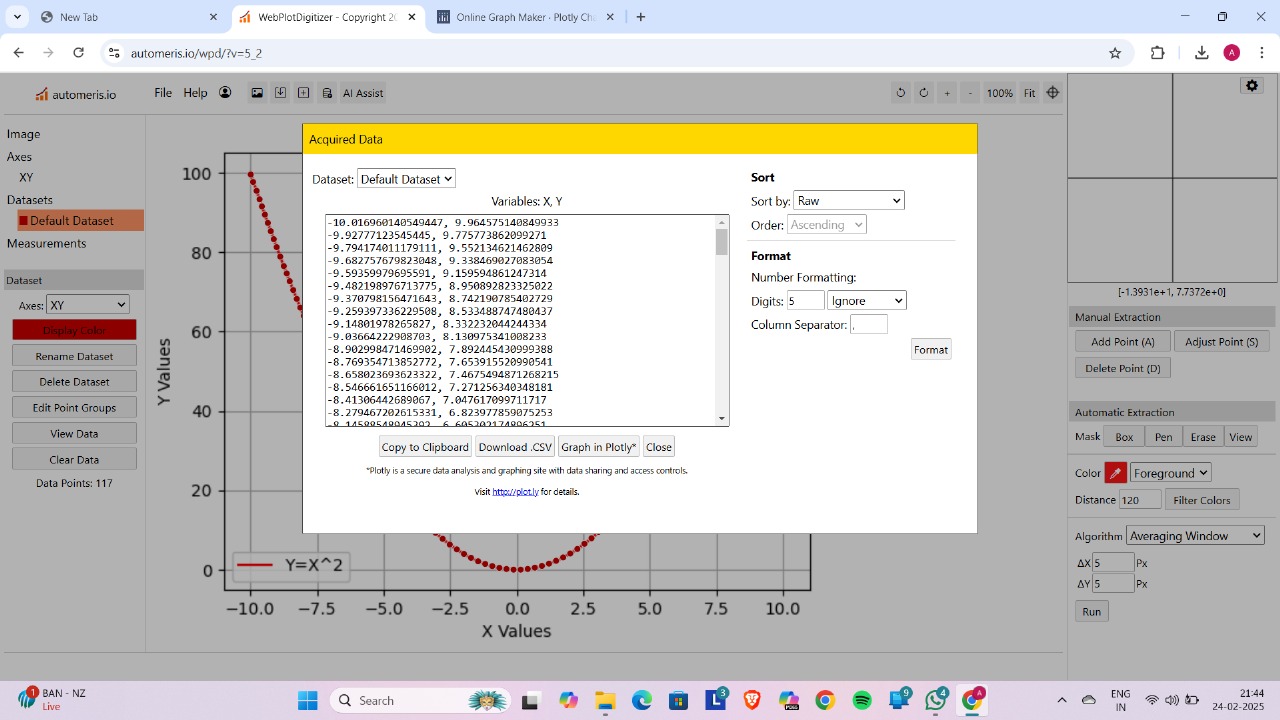
Then save the dataset of points in CSV format if you want.
___
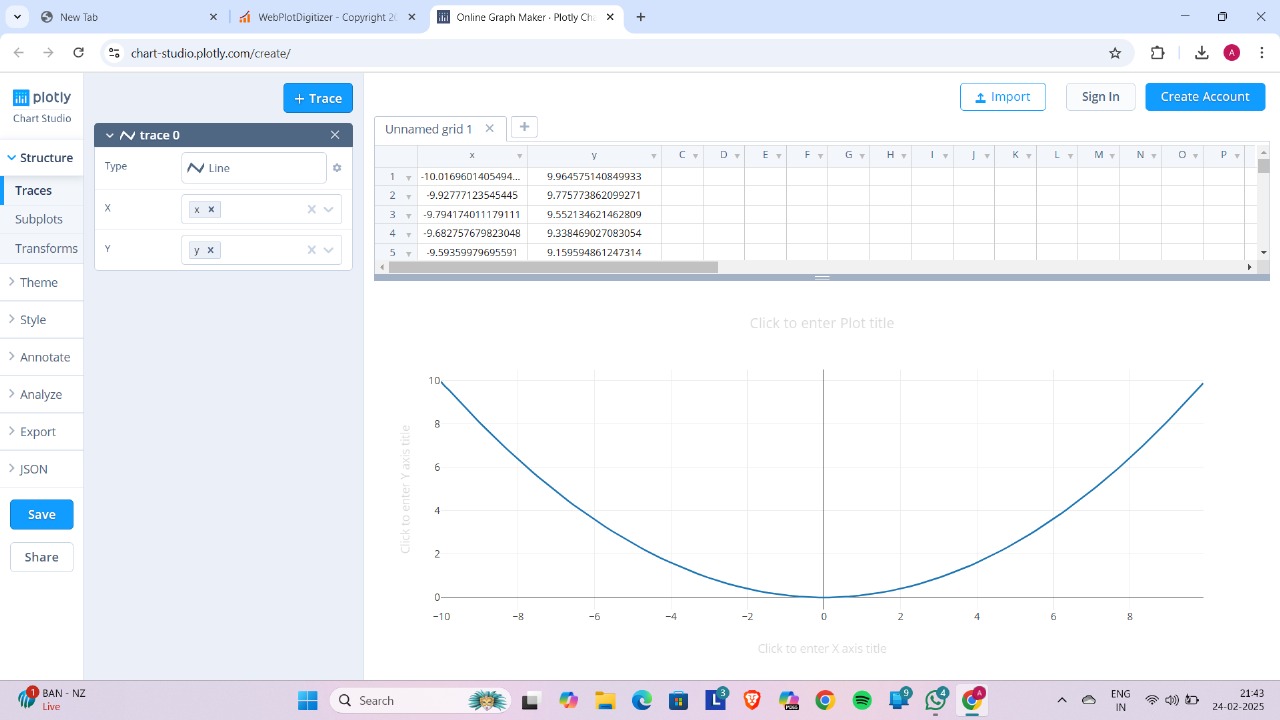 As proof, we have chosen the Plotly website and demonstrated the graph using the obtained dataset.
___
Conclusion
WebPlotDigitizer is a highly versatile and easy-to-use tool for digitizing data from graphs and charts. It offers AI-assisted features and computer vision algorithms to streamline the data extraction process, saving significant manual effort. Its ability to work with a variety of plot types, manual and automated digitization modes, and robust export options make it an invaluable resource for researchers, engineers, analysts, and students.
Whether you’re extracting data from a scientific paper or a presentation, WebPlotDigitizer makes the process efficient and straightforward.